Most organizations struggle with attaining real-time performance and utilization metrics on their storage infrastructure. There are many reasons for this, but mainly it is due to the vast number of disparate storage devices that exist in the architecture.
SANsymphony presents real-time metrics to show what is happening right now across all storage types and devices. The metrics can also be exported to the Windows Performance Monitoring (Perfmon) utility where other server parameters are tracked. When trend analysis is needed, simply enable a recording session to capture metrics over a longer period of time. SANsymphony has visibility into all connected devices including front-end channels, back-end channels, cache, physical disks, and virtual disks.
At a glance, you can see the top most active data volumes (virtual disks), making it easier to pinpoint the heaviest loads and their impact on response and capacity.
Once metrics have been captured, analysis can now be performed by running one of 20 different built-in reports. Reports can also be exported in many different formats including PDF, HTML, MHT, RTF, XLS, XLSX, CSV, text and several image formats (BMP, GIF, JPEG, PNG, TIFF, EMF, and WMF), for long term historical analysis.
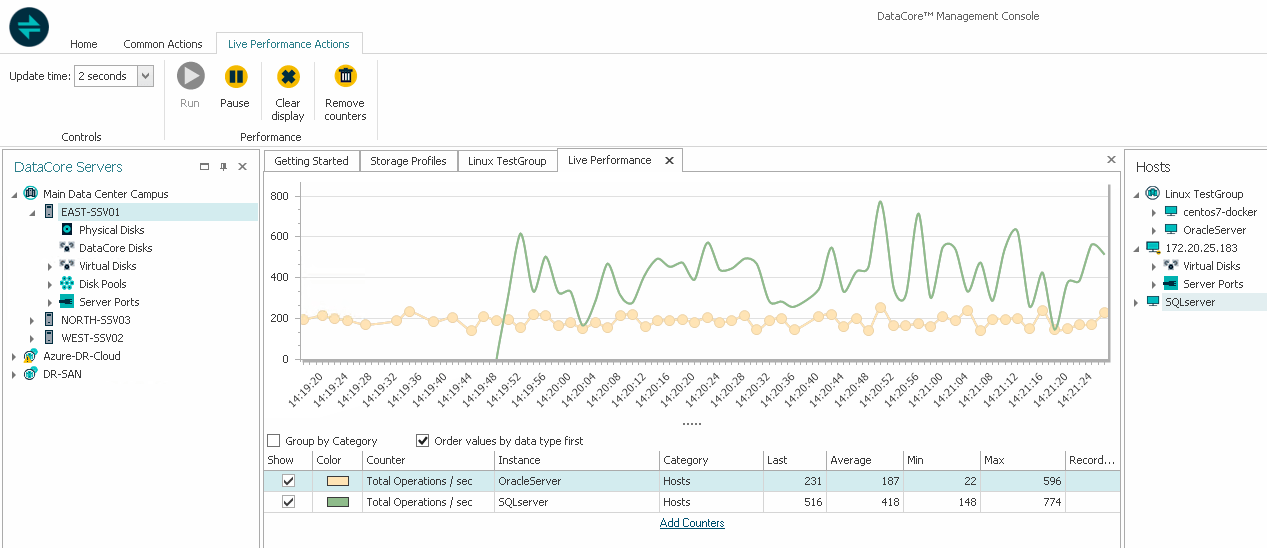
Live performance views provide detailed insight into what the entire storage architecture is actually doing. Hundreds of counters are available across all connected storage components.
Chargeback: Keeping track of who uses what
To help allocate costs, especially in private cloud and hosted cloud services, SANsymphony generates reports quantifying the storage resources consumed by specific hosts or groups of hosts.
The reports tally several parameters including:
- Total Bytes Transferred
- Total Bytes Written
- Total Bytes Read
- Total IO Operations
- Total Read operations
- Total Write operations
- Total Bytes Provisioned
Usage information can be exported in several tabular formats to equitably charge consumers for the services they’ve received over a specified period.
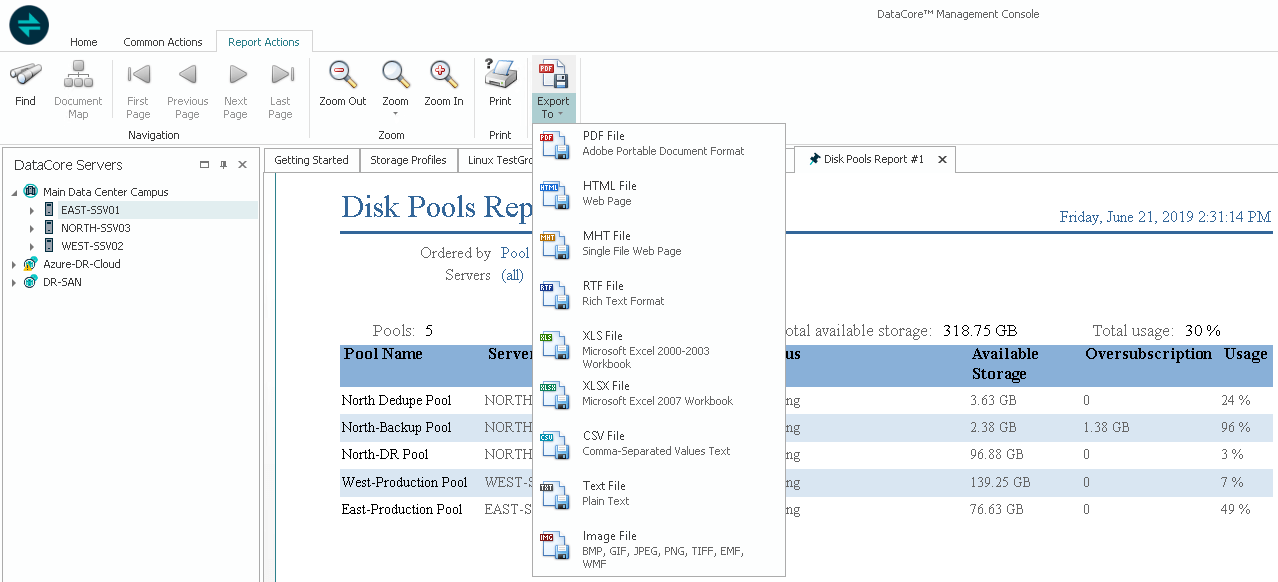
Export usage reports for billing and chargeback
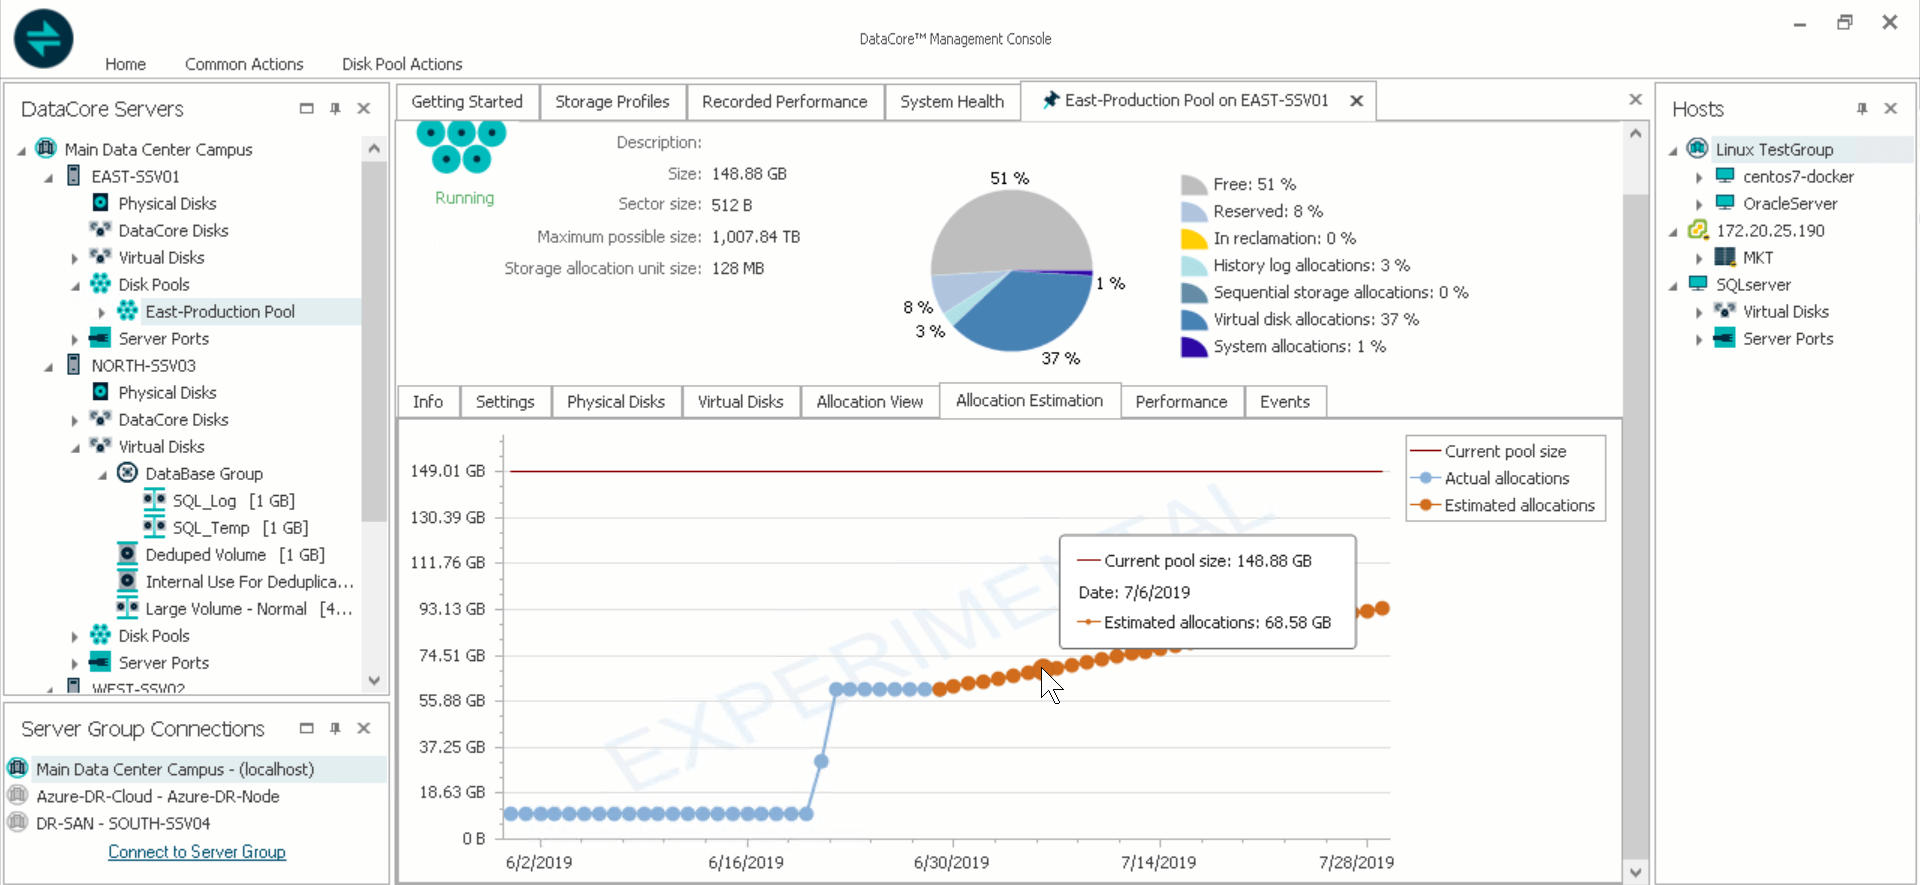
Capacity Planning
Disk pool depletion monitoring complements pool space threshold warnings by regularly evaluating the rate of capacity consumption and estimating when space will be depleted. The regularly updated projections give you a chance to add more storage to the pool before you run out of storage. It also helps you do a better job of capacity planning with fewer surprises.
Feature Highlights Summary
- Configurable views of system behavior and performance
- Drill down into real-time I/O statistics and chart historical behavior
- Pinpoint the heaviest loads and their impact on the system
- Save configuration snapshots for change management
- Export granular resource usage to billing and chargeback tools
- Estimate when more storage will be needed
- Customizable reporting features such as filtering and sorting
